import numpy as np

x = np.linspace(0, 2 * np.pi, 5)
np.round(np.sin(x), 4)
array([ 0., 1., 0., -1., -0.])A code block runs when the site is built, and its output is baked into the page. Readers see the source and the result side by side – no server, no execution in their browser.
import numpy as np
x = np.linspace(0, 2 * np.pi, 5)
np.round(np.sin(x), 4)array([ 0., 1., 0., -1., -0.])The same setup produces a plot. The figure below is saved as a static image at build time.
import matplotlib.pyplot as plt

t = np.linspace(0, 2 * np.pi, 200)
fig, ax = plt.subplots(figsize=(6, 3.2))
ax.plot(t, np.sin(t))
ax.set_xlabel("t")
ax.set_ylabel("sin(t)")
ax.grid(True, alpha=0.3)
plt.show()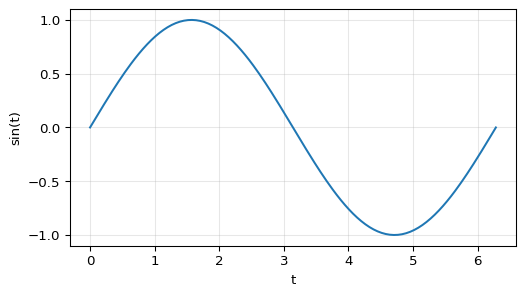
Because results are pre-rendered, pages stay fast and the site remains fully static.